The Challenge of the First Mile
The first mile of global supply chains remains one of the most challenging and least understood segments. From smallholder farms to artisanal growing operations, these initial points of production are often characterized by limited visibility, informal structures, and complex sustainability challenges.
There are a number of solutions that identify multi-tier supplier relationships, but none extend that visibility to the production facility on a consistent basis. The biggest challenge in creating that visibility is the lack of exhaustive list of processing facilities (e.g., palm oil mills, rubber factories, saw mills, coffee drying facilities). In the palm oil industry, Rainforest Alliance has led the development of the Universal Mill List (UML), which is supposed to be most comprehensive list of all palm oil mills. However, we have already identified several mills that are not on the UML. Most other commodities have no such list and even if one were to stitch together a list based on disparate government registration records, it would still be incomplete.
Our Approach
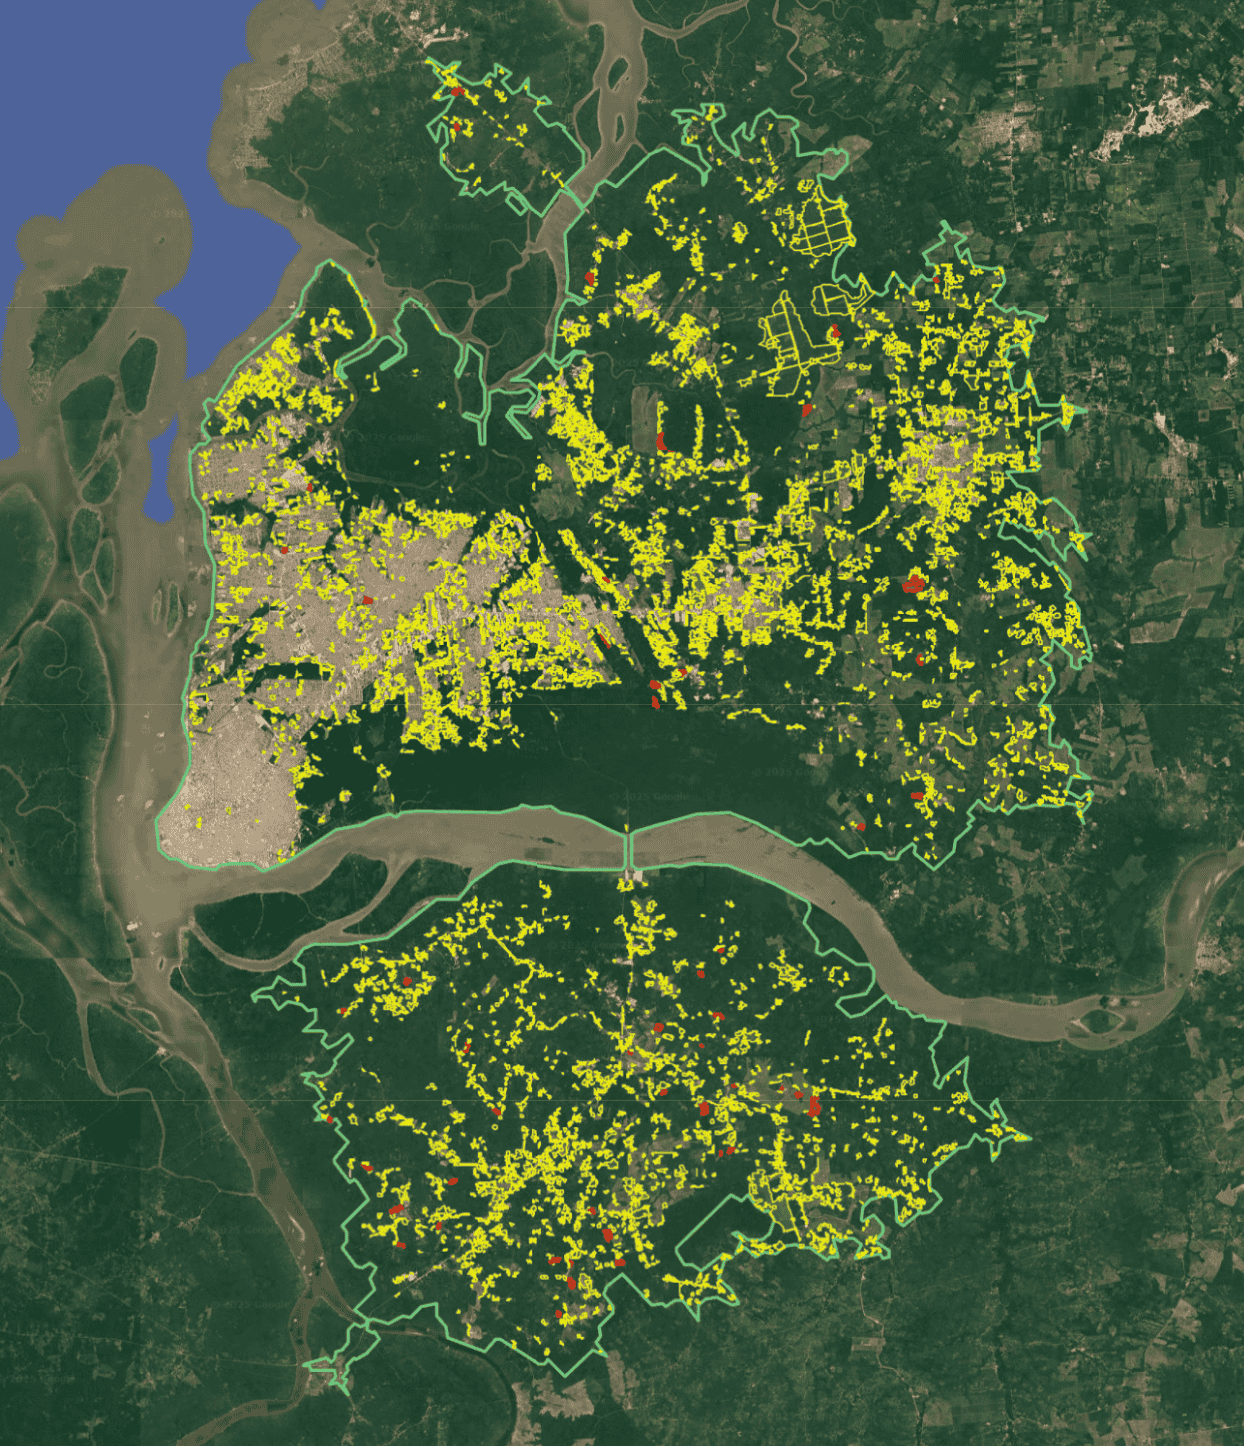
Working with our customers over the last 18 months, we have collected over 1 billion data points of training data, including a database of over 200,000 processing facilities of soft commodities - rubber factories, saw mills, paper pulp mill, palm oil mill, etc. We leverage this data to train models and look for facilities in areas of interest to identify the facilities that process the target commodity. We have discovered in many jurisdictions that the "official" lists (like UML) for Palm Oil Mills are incomplete and often do not include up to 30% of facilities. This is a significant problem for the industry as it makes it difficult to track the source of the commodity and the sustainability of the supply chain. Here's an example of the results of palm oil mill identification for a region in Sumatra
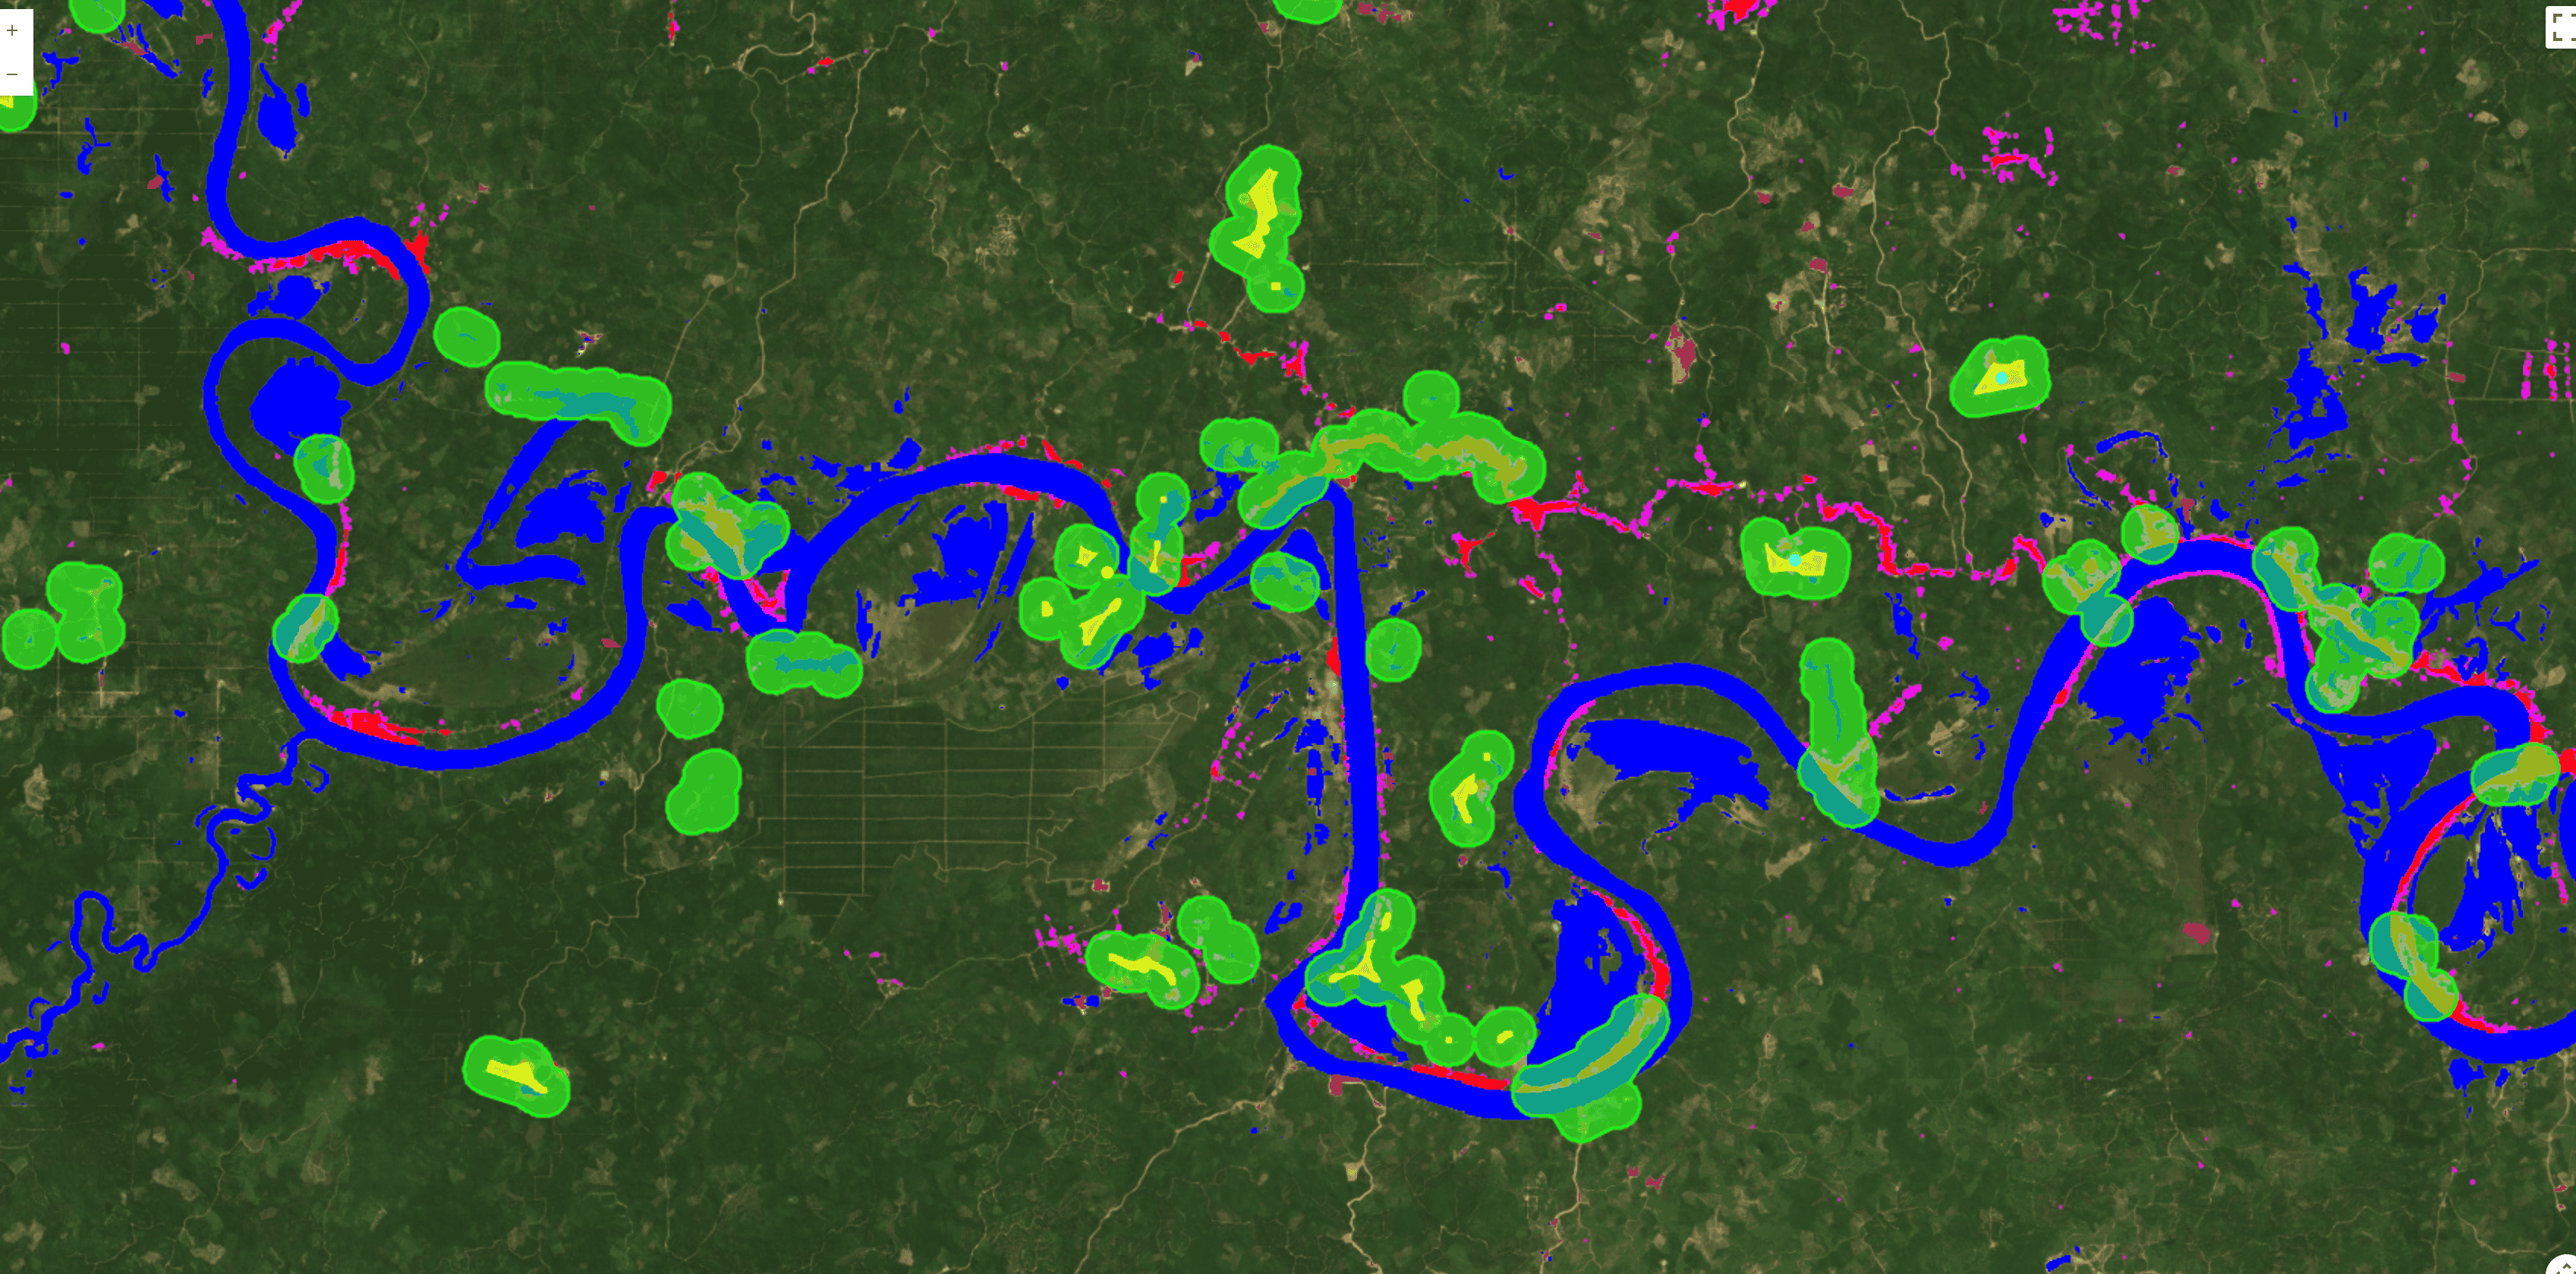
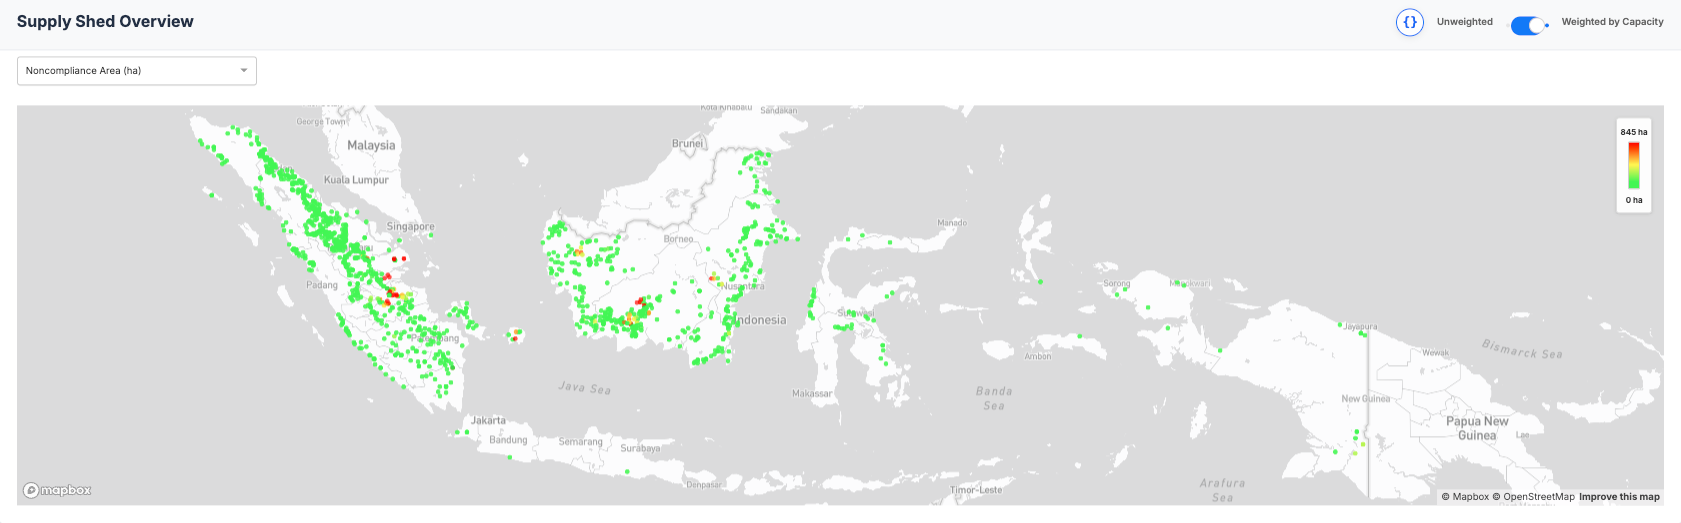
Once we identify the facilities, we generate a sourcing supply shed (or a sourcing region) for the target commodity. Given most commodities are sourced in the immediate regions as their processing facilities, we can derive a relatistic supply shed based on factors like travel time, road network, road speeds, elevation models, water bodies, and other factors. We then identify and delineate the individual plots and farm of that specific commodity within those supply sheds. Here's and example of a supply shed for timber sourcing in Brazil.
Implications
Linking the plots to the facilities and the facilities to the rest of the supply chain, we can start to complete the picture of global supply chains by tying the first mile to these supply chains. Our deforestation, emissions, water and biodiversity models then generate environmental data tied to the sourcing plots and landscapes tied to the processing facilities, providing unprecented visibility into production volumes, sustainability and resilience of different suppliers.
Generating this level of visibility exhaustively for entire regions and countries gives companies a better understanding of their sourcing options and the relative performance of their suppliers compared to the region. This also gives financial institutions, governments and corproates the best picture of their supply chain risk in a world of increasing climate and weather volatility.
Use Cases
This functionality currently supports a number of critical use cases:
- EUDR: For companies with long and complex supply chains, where visibility into first mile is low and obtaining geolocation data from suppliers is difficult, this allows companies to generate entire supply sheds and report in excess for lower risk jurisdictions. Even if deforested plots are identified, this allows companies to have a targeted outreach with their suppliers to ensure risk mitigation
- Sustainable Sourcing: This approach allows companies to remotely assess prospective suppliers for their compliance risk, resilience and sustainability performance, helping them make informed decisions about their supply chain
- Risk Management: Obtaining a complete picture of environmental metrics like deforestation, emissions, water and biodiversity tied to the first mile of supply chains allows companies to understand the nature and climate risk of different suppliers and inform decisions about their investments to drive resilience within their supply chains
Conclusion
Agricultural supply chains have always been opaque because of a low level of digitation. Because of AI models, the ability to digitize the first mile of these supply chains is cheaper, faster and within reach. This is a game changer for the industry and will help drive sustainability and resilience within supply chains.