Three methods produce the land-use-change line in a cocoa footprint. The standard that takes effect in January ranks them, and the two most commonly used are the ones it ranks lowest.
Last updated 3 September 2026.
Recently, a European chocolate maker walked us through how the land-use-change line in its product footprint had been produced. Its consultancy had supplied a questionnaire. One farmer, standing in for several dozen farms in a cooperative, was asked whether any deforestation had happened on the land since the cutoff year. The answer was no, so land-use-change emissions were entered as zero. The company believed this method had understated its footprint and wanted to replace it.
That method is common, as is a statistical default from a database, which assigns a country's deforestation emissions to every tonne of cocoa grown there. For cocoa the global default is 26.28 tonnes of CO2e per tonne of beans. That figure covers deforestation only and excludes farm emissions.
Another method is to measure the plots themselves.
We think most land-use-change numbers in soft-commodity carbon accounting are incomplete, and the two common methods err in opposite directions. One cocoa importer described its method as a single yes/no question to a farmer and a zero booked against the whole supply base, while the statistical default for the same crop runs in the tens of tonnes of CO2e per tonne. When we measured that importer's plots, the figure was just under 1 tonne of CO2e per tonne of cocoa beans.
What the new GHG Protocol standard requires
The GHG Protocol's Land Sector and Removals Standard was finalised on 30 June 2026 and takes effect on 1 January 2027. It sets a 20-year assessment period for land-use-change: conversion emissions from the twenty years before the reporting year are spread evenly across those years and assigned to everything grown on that land during that time frame. It ranks direct land-use-change measured for the individual land-management unit as most accurate, direct land-use-change at jurisdiction level second, and the statistical approach last, and it requires companies to use the most accurate approach their traceability allows.
The companion guidance says the statistical approach "assigns responsibility for land-use-change emissions" to products from a region "using a statistical proxy", and that "other actors beyond the reporting company influence the statistical land-use-change metric", meaning a cocoa buyer in a region where other people cleared forest is assigned their emissions. The SBTi's FLAG guidance, updated in March 2026, says the statistical approach "tends to estimate higher land-use-change emissions than direct land-use-change", and frames that as an incentive to improve traceability.
WRI's 2024 national factor for cocoa is 24.46 tonnes of CO2e per tonne in Cote d'Ivoire and 6.7 in Ghana. For the same crop, the Ivorian factor is nearly four times Ghana's, and the only input that differs is the country the farm is in. Within Cote d'Ivoire, municipality-level factors run from 6.24 to 91.35. WRI's note says subnational analysis reveals hotspots "masked by national averages" and shows variability that is "otherwise averaged together".
Two common answers to the GHG protocol
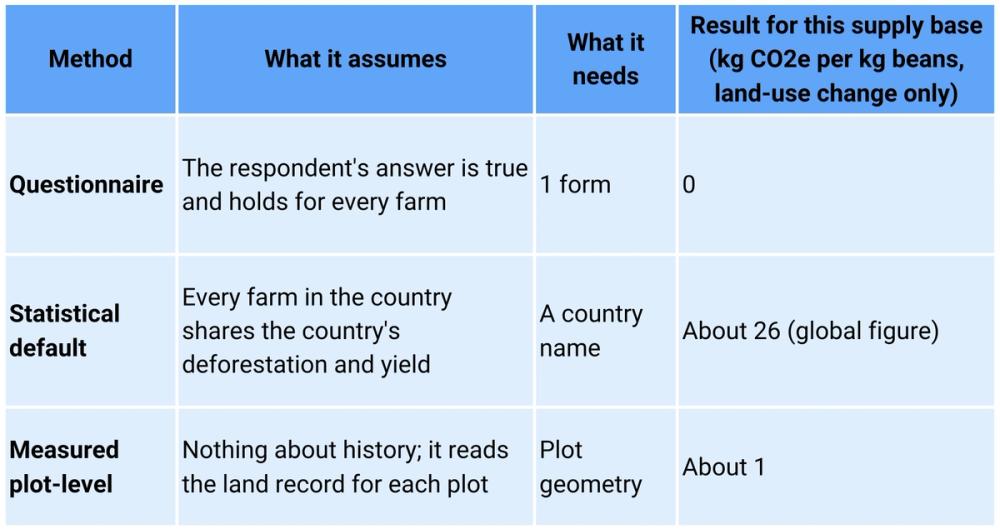
The questionnaire. The questionnaire method appears in the published literature. In the plot-level Wageningen study behind a published Cote d'Ivoire cocoa footprint, whether a plot had been converted from forest was taken from the certification survey: farmers were asked whether the land had been primary forest, secondary forest, or fallow. This method does not check the answer against the land, and the standards do not require such a check. The GHG Protocol's Product Standard allows a product footprint to be assured by a first party, meaning people inside the reporting company, so nothing requires anyone outside the company to check the answer. Sampling one farm for management data such as fertiliser use is a defensible shortcut, but the land-use-change answer can be checked against a land record, and in this case nobody checked it.
The questionnaire also covers the wrong period. The standard's assessment period is twenty years, but the farmer was asked only about the years since the cutoff date, so even an honest answer leaves fourteen years of land history unexamined.
The average. The databases that supply default factors to corporate footprints state what they assume. The World Food LCA Database makes "no formal difference" between direct and indirect land-use-change, allocates a country's twenty years of cropland expansion across its crops, and divides by a national average yield. Agri-footprint describes its land-use-change figure as an estimate "if previous land use is not known". Both describe a whole country, so they can often overstate the figure for any farm in it that did no clearing. Becker and colleagues put Ivorian cocoa at 2 kg of CO2e per kg of beans before statistical land-use-change and 30 kg after it, so the default supplies 93% of the total.
The default overstates most for producers with no conversion in their land history. A meta-analysis of 52 paired studies found cocoa agroforestry systems store 2.5 times the biomass carbon of monocultures, 37 against 14 tonnes of carbon per hectare, and yield about 25% less. A default built on national expansion assigns the agroforestry farm clearing that happened elsewhere in the country. We said as much to the chocolate maker: industry averages assume fairly recent land conversion and monoculture farming with no agroforestry, and for a specialty producer that is damaging.
Epoch’s analysis reveals the true footprint is 96% lower than average emissions
For the same chocolate maker we ran the third method on the cooperative's plots. The inputs were plot geometry, a satellite land-cover history going back twenty years, the carbon stock of what stood on each plot before conversion, and the beans each plot produces. Conversion emissions per plot were spread over the assessment period and divided by production.
The result for land-use-change alone was just under 1 kg of CO2e per kg of beans on national average yields, against a global default of 26.28. The yield in the denominator also needs checking. Every per-kilo factor divides by a yield, and national averages for cocoa run from 0.46 tonnes per hectare in Indonesia to 0.75 in Ecuador. A farm producing a tonne per hectare halves the national default before any land history is checked, so the yield needs to be measured as well as the land history.
The measurement also showed that excluding the plots flagged for deforestation after the EUDR cutoff moved the land-use-change factor by less than 2%. Compliance status and carbon intensity are different questions, and a low average carbon intensity does not by itself show that every plot is compliant. The spread between plots was wide, which matches the literature: in one modeled set of Ivorian fields, plot results ranged from 212 kg of CO2e stored to 116 kg emitted per kg of cocoa around an average near 3.6. A single average—whether a national default or a supply-base mean—hides that range and cannot be checked against any plot's land record, whereas a plot-level figure can.
The table below sets the three methods side by side.
What we'd take from this
The land-use-change line is the largest item in a cocoa footprint, 55% of dark chocolate's emissions in the Poore and Nemecek dataset behind Our World in Data's food emissions chart, and both common methods produce it without measuring anything. The standard that governs it ranks the measured plot-level figure first and the statistical default last. If your footprint carries a zero, someone should be able to say which twenty years of land history it rests on. A footprint that carries the default is reporting the country's deforestation rate for suppliers who may not have cleared any forest.
To check, take the last product footprint you published, find the land-use-change line, and ask which of the three methods produced it. For any sourcing lane where plots exist, ask for the measured figure. Where they don't, the standard's middle tier, a defined sourcing region, is available, and a supply shed meets that definition.
Epoch measures plot-level land-use-change from the same plot data it uses for deforestation due diligence. The twenty-year land history the carbon standard asks for and the 2020 cutoff the EUDR asks about come from one record. The chocolate maker's first question on seeing the measured figure was whether an auditor had to sign it before it could be used. The Product Standard permits first-party assurance, but we recommend and can work with third parties to review the figure before it is used.
If you'd like to learn more about how we measure plot-level land-use-change and deforestation from the same first-mile data, or put the product to work in your supply chain, reach out to us here.
Or, subscribe to our newsletter to get the latest on supply chain risk management, EUDR, deforestation, water stress, and the latest trends in geospatial AI.